Tag Archives: municipal

Less Parking or More? City Planners on What AVs Mean for Them

Autonomous vehicles (AVs) will reduce the demand for parking in cities. Or they might increase it, depending. Same for the need for driving lanes, which affect the availability of bike lanes and pedestrian pathways. They might make cities more–or less–walkable, too.

The debate over driverless continued this weekend with a Washington Post dive into what AVs might mean for cities. The news outlet asked city planners what they thought the advent of driverless cars will mean for them, and the answers varied widely. Much of the ambiguity stems from the way we’ll use driverless vehicles (Will we share or own our own?), which will depend on pricing, attitudes, fuel, and a host of yet-unknown factors. One thing is clear: Driverless cars will definitely change the way we get around, and that will change the way our cities operate.

Read the whole story here and talk about it on Forum–how will AVs change your city?

The Future of Mobility

By Kelsey Owens

CITIES ARE EVOLVING faster than ever before. Populations are getting denser, congestion is increasing, and new modes of transportation are being intro­duced, bringing tremendous opportunities and challenges. With the increasing rate of innovation, what will cities look like five, 10, or 20 years down the road?

The future is unknown, but that can’t stop park­ing and transportation leaders from taking action now. To prepare for the future, cities need to create a digital transportation infrastructure, focus on the customer journey, and develop dynamic pricing mod­els to influence behaviors in order to create fair and equitable solutions.

Building a Digital Infrastructure

Since the introduction of cars, cities have adapted their physical infrastructure to support these vehicles. Roads, sidewalks, curbs, stop signs, traffic lights, me­dians, crosswalks, street signs, and parking meters all require physical changes to improve the way vehicles and people move around a city.

Most city solutions have been focused on hardware and physical infrastructure, but with the growth of technology, the focus is shifting to software and tech solutions. A decade ago, U.S. cities began to imple­ment mobile pay-for-parking apps to supplement parking meters and provide a digital way to pay. Now, some cities are removing meters altogether in favor of a mobile-only solution.

As the world becomes more digital, transportation leaders should consider changing their city infrastruc­ture at a digital level. To determine if a parking space is full, cities can develop predictive availability models based on historical data and trends. Instead of impos­ing scooter caps or medallion-like permits, cities can implement a digital solution to manage scooter distri­bution across their city. A solid digital foundation can help create a more connected mobility ecosystem. This allows cities to more flexibly adopt new innova­tions and gives them control over what technologies are implemented to best serve citizens’ needs.

User-oriented Transportation Solutions

With many possibilities for getting around, citizens can use multiple modes of transportation to get from point A to point B, but they have to manage each mode separately. Agencies are recogniz­ing this trend and shifting from mode-oriented to ­user-oriented services.

One example is Miami-Dade’s Department of Transportation and Public Works in Florida, which was created to embrace mobility management and improve the transportation experience for citizens. More cities are considering a similar approach as they understand that when parking, transit, and micro-­mobility are managed collectively, leaders can make better decisions for positive city outcomes.

We’re also seeing a focus on the user journey for first- and last-mile solutions. In 2018, the Charlotte Area Transit System (CATS) began a partnership with Lyft to offer subsi­dized rides for users of the CATSPass app. Passengers who originate or terminate a trip at specific locations receive a contribution toward their Lyft fares. With this partnership, CATS increased public transit use by providing options to use multiple forms of transportation in a single journey.

Influencing Behaviors through Pricing

Dynamic, progressive, and congestion pricing are hot topics in the mobility industry. Some agencies have implemented pricing models, such as the San Francisco Bay Bridge in Cali­fornia, which charges a higher toll during rush hour to reduce bridge traffic, and the Long Island Rail Road in New York, which charges higher fares at peak times. Some cities, such as Boston, Mass., and Chicago, Ill., have tried dynamic pricing models for on-street parking.

Price can be a motivating factor for consumers, influenc­ing behaviors to achieve desired outcomes. By raising park­ing prices in a downtown area and reducing them outside the city center, people are more inclined to park farther away and find a secondary method of transportation to get to their final destinations. This can lessen circling for parking—a leading cause of city congestion.

The idea of dynamic pricing is going beyond tolls and car parking and is being applied to micro-mobility. The cities of Charlotte, N.C.; Detroit, Mich.; and Omaha, Neb., are in the midst of a six-month pilot program to test pricing models for scooter parking to make them more accessible and decrease sidewalk congestion.

Our industry is at a critical point, with unlimited op­portunities, but many unknowns lie ahead. Transportation leaders need to think proactively about how to create sys­tems today that can be adapted easily as new modes and challenges arise.

Read the article here.

KELSEY OWENS is director of municipal sales at Passport and a member of IPMI’s Technology Committee. She can be reached at kelsey.owens@passportinc.com.

ICYMI – Initiatives by U.S. Mayors Impact Parking, Transportation, & Mobility Programming

By Rachel Yoka, CAPP, LEED AP BD+C

A recent survey demonstrates that the United States Conference of Mayors has an impact on our industry’s programming and initiatives.   The Conference has teamed up with the Center for Climate and Energy Solutions (C2ES) to target greenhouse gas emissions responsible for the growing effects of climate change.

Some of the findings include:

  • Renewable energy is on the rise and cities are buying in; 65 percent utilize renewable electricity sources for operations and are using it at a greater rate than in 2017.
  • Green vehicle purchasing programs are impacting purchases: almost 60 percent of those surveyed have such programs and many of them use these policies for fleet purchases.
  • Bike-share (and scooters) are gaining ground, with more than 20 percent of respondents considering both bike- and scooter- sharing.

Sound familiar?  It should – the industry is mobilizing to explore and integrate alternative forms of transportation to cut GHG emissions, congestion, and pollution.  These programs diversify transportation modes and aim to decrease single-occupant vehicle trips .   Appropriate parking pricing, as our members and colleagues well know, has a tremendous impact as well.

Need help deciding how to pitch in?  IPI’s Accredited Parking Organization program and the USGBC’s Parksmart program address these programs and many more.  What are you doing in your city, or on your campus?  Share it with us and blog about it – inquiring minds want to know.

Rachel Yoka, CAPP, LEED AP BD+C, is IPI’s vice president of program development.

ON THE FRONTLINE: Be Who You Represent

By Cindy Campbell

I RECENTLY SAT DOWN FOR DINNER in a well-known chain restaurant during my travels. Arriving in town the night before a long week of training, I decided a decent meal would be a good idea. Now, I’ve dined at this national chain a number of times and I always leave with a very positive feeling about food quality and customer service, so it surprised me when the proverbial wheels came off the wagon on this particular visit.
It started out as it always has: I’m seated, menu provided, drink delivered, order placed. It did seem to take an exceptionally long time for my simple order to arrive, and when it did, I im­mediately noticed that it wasn’t right. Knowing that things like this happen, I politely pointed it out to the server. Without comment, he picked up the plate and took it back to the kitchen.

After 20 minutes, I asked if he thought it would be much longer. His response started with a heavy sigh and finished with, “I’ll check with the kitch­en.” An additional 25 minutes passed and at that point, I was done. The server stopped again at the table and told me he would recheck with the kitchen, to which I responded, “No. I’m done. I believe I’ve waited long enough. If you would give me my bill for the drink, I’d appreciate it.” Again, without comment, he briefly stepped away and came back with my bill.

As he set it down, another server ar­rived at the table with my order, which, frustratingly, was still not correct. The server silently stood looking at me, presumably waiting to see if I wanted to keep it this time around. “Sorry, still not what I ordered,” I said. He shrugged his shoulders and curtly responded, “Well, I don’t know what to tell you. It’s not my fault. I gave the right order to the kitch­en.” In fairness to this young man, his observation could have been ­accurate—it’s entirely possible that he had entered the order correctly and kitchen staff had misread it twice. Here’s my point: The issue wasn’t in the mistake happening; it was in the server’s failure to under­stand his role as a representative of the brand.

Representing the Brand
We all work for someone. Whether you work for a private company, a public organization, or even if you’re self-­employed, in some way we all represent a larger entity. Let’s say for example that you work for a municipality as a parking ambassador. You may be the only city representative with whom members of the public have ever per­sonally interacted. At that very moment, you are the face of the city. Your atti­tude, demeanor, word choice, and body language help shape their opinion of you, your agency, and of the city—the entire city.

What about service limitations, agency policies, or even errors that are out of our control? What happens when the customer is unhappy and you’re left holding the proverbial bag on behalf of the city? Is it OK to sim­ply shrug your shoulders and declare that it’s not your fault? The public will not always be satisfied with the answers and options you are able to give. In that moment, you have the responsibility to recognize that you are the city, and even when you don’t agree with the options, you must always be who you represent. With your words and actions, you have the potential to shape perceptions and future decisions about you and of your greater agency, even if the circumstances are completely out of your control. Setting our personal viewpoints aside can be difficult. Because we represent a larger brand, we must consistently fight the urge to disassociate ourselves from regu­lations or circumstances with which we disagree. This type of professional disassociation serves no one well.

The Takeaway
That night at the restaurant, I left feel­ing frustrated. I know that I will never go back to that specific restaurant, and it will probably be a very long time before I set foot inside another of the franchise locations. I committed to telling others about my bad experience, knowing that many of them may adopt my viewpoint and avoid experiencing it personally.
One more notable thing to share about this experience. As I walked away that night, I was also thinking about situations early in my career where I’m certain I reflected poorly on my person­al brand and that of my employer. On many occasions throughout my career, I know I’ve made similar customer service blunders where I lost sight of my brand and who I represented. The lessons are there if we’re willing to rec­ognize and learn from them.

Read the article here.

CINDY CAMPBELL is IPMI’s senior training and development specialist. She is available for onsite training and professional development and can be reached at campbell@parking-mobility.org

Smarter than the Average Detective

tpp-2016-03-smarter-than-the-average-detectiveby Charlie Francis


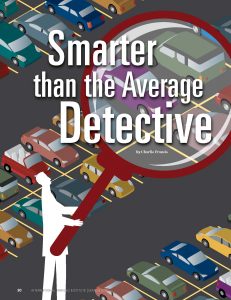
How municipal parking finance professionals can catch parking bandits with data visualization. 

I FIRST ENCOUNTERED the parking industry in the early 1970s as an entry-level accountant. I had to manually count the number of parked cars in each of Denver’s public parking lots between downtown and what is now called the LoDo (lower downtown) District as an internal control check on our parking operator. There wasn’t any technology in those lots—just the ubiquitous honor boxes. Nor could I use any technology to help count the spaces; I tallied my results on daily ledger paper using an adding machine that couldn’t even hold a number in memory. Every month, I would compare my daily counts to the parking operator’s monthly remittance as a way of ensuring the public was receiving all the revenues to which it was entitled.

Data visualization was physical, not digital. I physically had to see the cars and physically interpret the counts. Analysis was difficult—trends and patterns got lost in the noise of big data.

Counting cars in parking lots was a fun task in the summer of 1973, but during that freezing winter, I began to dream of leveraging my bachelor’s degree in a warmer location. I continued for three more years, toiling endlessly, adding columns and rows, and footing and cross-footing totals in sequential reconciliations; at least technology improved calculators to hold a number in memory!

Finally, in 1979, I moved to Florida for my first finance director position. And I was still in the parking business! Honor boxes gave way to parking meters, which were an important source of revenue from the beach parking lots of my small, barrier-island community.

Available Data
Meanwhile, calculators gave way to desktop computers. I became adept at using VisiCalc, the first spreadsheet computer program. It forever changed my way of thinking about the world—no longer were calculations sequential, but simultaneous! Four years later, Lotus 1-2-3 entered the market as a three-in-one, integrated solution that handled spreadsheet calculations, database functionality, and graphical charts—hence the name 1-2- 3. I retired VisiCalc and pasted years of daily parking meter revenue from each of the city’s beaches into Lotus 1-2-3. Once the data were loaded, I started graphing the results. I created both incremental and cumulative year-over-year graphs and incremental and cumulative month-over-month graphs. I generated the graphs citywide and for each beach and quickly became an expert at creating Lotus 1-2-3 graphs. They were good-looking graphs—well, as attractive as Lotus 1-2-3 graphs could be, running on DOS computers, back in 1983.

Something Fishy
One day, as I was admiring the handiwork of my new skill, I noticed something curious in the trends depicted in the graphs. Every year, during one week in the height of each summer season, parking meter revenues plummeted. Multiple views of the data showed me this was not a fluke. There was no logical explanation for this abnormality; the city never declared a parking holiday because parking was a mainstay of our revenue base.

The beaches were never closed. There were no neighboring events that competed for beachgoers, reducing demand. The bridges were neither closed nor down for scheduled maintenance. Nothing seemed to explain the deviation.

Then, one evening, I was reading how Sherlock Holmes wrestled with a problem in “The Sign of the Four.” He asks Watson, “How often have I said to you that when you have eliminated the impossible, whatever remains, however improbable, must be the truth?”

“Aha,” I said to myself, and the next day, I told the police chief he should stake out the parking lots during that one particular week. We found that Midwest-based parking lot bandits had an accomplice working at the meter manufacturer and that partner in crime obtained the new master cylinder key for our parking lots. Every year, the bandits would pay for their Florida vacation by emptying the parking meters. Caught red-handed!

Visualization
Data visualization and analysis tools won’t catch parking meter thieves every day, but visualization enables finance directors to identify trends, understand the big picture from large amounts of data, and spot unusual patterns. New operational reporting and analytics tools enable finance professionals to tell better stories (the 2015 Goverment Finance Officers Association theme) and create effective personal reports that permit city councils, city managers, and department heads to see the city’s financial condition at both a high-level glance and at the granularity of the transaction level.

Finance directors are visualizing and analyzing data to better interact not only with their own information but also with their neighboring, regional, and comparison city’s data! And they are able to interact, analyze, and present information with greater velocity—more time to analyze and add value to information and less time spent collecting data. This yields productivity, efficiency, and creativity.

Going forward, new tools will provide city finance professionals with the ability to not only detect and confirm spending inefficiencies, or unrealized revenue, but also to predict, compare, and collaborate on new transformative approaches that will guide the policy decisions for fiscally stable and structurally balanced city governments.

I ended my career in a California city still in the parking business—spearheading a multiphase request for information procurement process to optimize parking technology. The resulting off-street pay station and instreet smart meter installation provided for innovative technologies that integrate credit-card transactions and mobile pay-by-phone applications, on-demand pricing with citation payments, permit management, and builtin data visualization tools.

Best of all, license-plate-enabled readers for enforcement means no more physical daily car counts!

TPP-2016-03 Smarter than the Average Detective